| 📦 Feature Availability | ||||
|---|---|---|---|---|
| Free (Desktop) |
Lite (Mobile) |
Pro (Desktop) |
Lite Pro (Mobile) |
Pro Biz (Desktop) |
| ✅ | ❌ | ✅ | ❌ | ✅ |
| What do these plans offer? | Upgrade Plan |
Table of Contents
- What is ScribbleSight?
- Using ScribbeSight
- Reports and Credits
- Viewing Results on the Map
- Reviewing and Adjusting Results
This article explains what ScribbleSight is, what it’s used for, and how to get started.
ScribbleSight™ makes it easy to evaluate and compare locations using data-driven insights. Whether you're scouting for real estate, planning a business, or finding the perfect vacation rental, ScribbleSight helps you make smarter location decisions in just a few clicks.
What is ScribbleSight?
ScribbleSight is an analysis tool in Scribble Maps that helps you identify and compare the best areas for a specific purpose, such as real estate, retail, commercial planning, or site selection.
Instead of manually reviewing multiple datasets, ScribbleSight scores and visualizes areas on the map based on the criteria you choose. You can start by describing what you’re looking for in plain language, then refine the results using sliders and settings.
You can use ScribbleSight to:
- Compare neighbourhoods or regions visually
- Identify high-performing areas based on selected factors
- Explore walkability, access, and nearby amenities
- Support decisions with data-driven map overlays
ScribbleSight combines AI-driven analysis with real-world data to score and visualize locations on your map.
When to Use ScribbleSight
ScribbleSight is useful when you need to:
- Compare multiple locations quickly
- Support decisions with visual data
- Explore accessibility and nearby features
- Narrow down large areas to high-potential zones
- Score Per Capita
How ScribbleSight Works
ScribbleSight evaluates areas by assigning scores based on criteria you choose. These scores are visualized directly on the map so you can quickly see which areas perform better or worse.
At a high level, the process is:
- Choose how areas should be evaluated (walking, biking, or driving).
- Set a distance or time range.
- Select what factors should increase or decrease an area’s score.
- Review the results on the map.
ScribbleSight evaluates locations using a grid-based system, scoring each area independently based on your criteria.
Scores can also be normalized per capita to compare dense urban areas and less-populated regions more fairly.
Using ScribbeSight
ScribbleSight is designed to help you evaluate and compare locations visually using real-world data. It works directly on your map and updates as you explore different areas.
Opening ScribbleSight
ScribbleSight is accessed through the Launch Pad.
To open ScribbleSight:
- Click Launch Pad in the footer at the bottom of the map, then select ScribbleSight™.
- (Optional) If ScribbleSight is not visible, use the arrow controls on the banner to move through the available cards.
- Click the ScribbleSight™ banner.
Once opened, the ScribbleSight panel appears on the left side of the map.
Choose Your Area of Interest
In the Map View, pan and zoom the map until the blue grid covers the area you want to analyze.
This grid defines the scoring area for your custom heat map and scorecard.
Describe Your Grading Request
In the left-side panel, enter a natural-language description of your grading request.
Example: “Every performing arts theatre, college, university that do not have a coffee shop nearby.”
ScribbleSight uses AI and real-world data to interpret your input and match it to relevant map features.
After you click CREATE, ScribbleSight displays Your Custom Grading for your search, showing the factors it identified, such as Performing Arts theatre, University, Coffee Shop, or Cafe and related preferences or penalties. Click OK to continue.
Grade for Size
Grade for Size controls how ScribbleSight measures coverage, accessibility, and comparison across an area. These settings define how far, how dense, and from what perspective locations are evaluated.
Use the Walking Minutes (or equivalent) setting to define how far ScribbleSight should evaluate around each point.
You can also control how the area is divided using the Areas setting, which determines how detailed the scoring grid is.
Together, they determine how each grid cell is scored and visualized on the map.
Travel Mode
Choose how distance is calculated based on how people realistically move through the area:
- Walk: Measures accessibility using walking distance. Best for neighbourhood analysis, daily amenities, and pedestrian-focused use cases.
- Bike: Measures reachability by cycling. Useful for urban areas where bike access meaningfully expands range without relying on cars.
- Car: Measures accessibility by driving distance. Best for regional analysis, suburban areas, or destinations people typically reach by vehicle.
Changing the travel mode affects both distance calculations and which routes are considered accessible.
Distance or Time Range
Set how far ScribbleSight evaluates from each grid point:
- Walking Minutes
- Biking Minutes
- Driving Minutes
The label updates automatically based on the selected travel mode.
This setting controls the radius of influence for each grid cell. Larger values evaluate broader access, while smaller values focus on immediate surroundings.
Grid Density (Areas)
The Areas setting controls how the map is divided for scoring.
- Minimum: 4 areas (2×2)
- Maximum: 100 areas (10×10)
Lower values create broader zones that highlight general trends.
Higher values create a finer grid, revealing more localized variation between nearby areas.
There’s no “best” value. Fewer areas are easier to read; more areas provide deeper detail.
Show Areas
Enable Show Areas to display the evaluation grid directly on the map.
This visual overlay helps you understand:
- Where each score originates
- How coverage overlaps between grid points
- Why certain areas score higher or lower than others
Turning this on is especially useful when adjusting distance or grid density.
Managing Factors
ScribbleSight evaluates areas using factors that either increase or decrease an area’s score. These factors represent the things you want to prioritize or avoid.
For any factor, you can:
- Adjust its weight by dragging the slider or entering a percentage
- Remove it by clicking the × icon
- See the overall score update automatically as you make changes
Positive factors are balanced so their combined weight always totals 100%.
Adding or Removing Factors
Click + Add Positive or + Add Penalty to open the factor selection panel.
In this panel, you can:
- Use drop-down filters (Rating, Price, Status) to narrow results
- Use the Search field to quickly find specific places or categories
- Select or deselect items to include them as factors
When finished, click × to close the panel and return to the map.
Positively Grade For
Positive factors increase an area’s score.
Use positive factors to highlight things you want more of, such as amenities, accessibility, or environmental qualities. Increasing a factor’s weight makes areas with more of that feature score higher.
Penalize For
Penalties reduce an area’s score.
Use penalties to account for things you want to avoid, such as noise, pollution, or incompatible businesses. Increasing a penalty’s weight causes areas with more of that feature to score lower.
Penalties are optional and can be added or removed at any time.
Score Per Capita
Enable Score Per Capita to normalize results based on population.
When this option is enabled, ScribbleSight divides factor counts by each area's population. This helps ensure locations are compared more fairly, especially when population density varies.
When to Use Score Per Capita
Score Per Capita is useful when you want to:
- Compare dense urban areas with less-populated regions
- Identify locations with the highest concentration per person, not just the highest raw counts
- Avoid large populations overpowering results simply due to size
For example, a neighbourhood with fewer total coffee shops may still rank higher if it has more coffee shops per resident.
You can turn Score Per Capita on or off at any time. The map updates immediately to reflect the change.
Reports and Credits
ScribbleSight reports require credits to generate.
Before purchasing a report, you can preview results directly on the map. When you’re ready, click Purchase Report to generate a detailed analysis.
Your available credits and the cost of the report are shown in the ScribbleSight panel.
Reports can be saved and shared, allowing others to view your heat maps and analysis.
Credits
ScribbleSight reports use credits. Click the Credits amount to see a brief breakdown of what contributes to the total cost before purchasing.
Your Credits (Buy More)
Your available credit balance is shown in the ScribbleSight panel.
Click Buy More to purchase additional credits. For details on credit pricing and purchasing, see Credit System, Terms & Refund Policy.
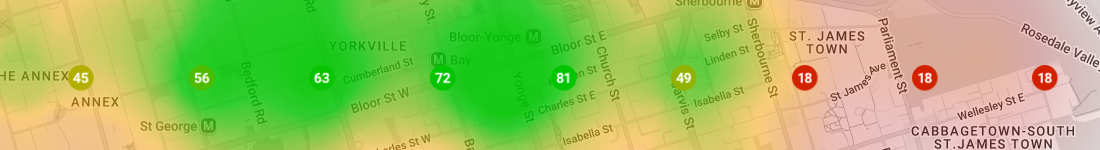
Viewing Results on the Map
As you adjust settings, ScribbleSight updates the map in real time.
Higher-scoring areas appear more prominently, making it easy to spot strong candidate locations at a glance.
You can pan or zoom the map to explore different regions while keeping your criteria intact.
Purchase Reports
When you’re ready to generate a report, click Purchase Report at the bottom of the ScribbleSight panel.
You’ll be prompted to:
- Enter a report name
- Review the credit cost and remaining credit balance
Click Spend Credits to generate the report, or Cancel to return without spending credits.
Once purchased, the report is created. Click Ok.
Reviewing and Adjusting Results
This screen lets you review your results and adjust how they are displayed on the map.
Viewing Results on the Map
This screen shows your completed ScribbleSight results and lets you fine-tune how your factors are applied and how results are displayed on the map.
Adjusting factor weights
Under Positively Grade For and Penalize For, each factor includes:
- A slider to increase or decrease its influence.
- A percentage field where you can enter an exact value.
- A gear icon that opens additional options for that factor, such as setting a minimum or maximum count when supported.
The Balance Weights link automatically redistributes percentages so totals equal 100% for positives and penalties. You can use this at any time while adjusting factors.
Hiding map details
Below the factor lists, you can control how results appear on the map:
- Hide Points removes individual score markers.
- Hide Areas removes coloured grading areas.
These options help reduce visual clutter while reviewing results.
Changing the map view
You can switch between different visual layouts:
- Heatmap shows smooth colour gradients.
- Hex Grid displays scores in hexagonal cells.
- Square Grid displays scores in square cells.
Each view highlights high- and low-scoring areas in a different way, depending on how you prefer to analyze the data.
Finishing or Creating a New Report
Once you are satisfied:
- Click I AM FINISHED to close ScribbleSight and keep the results.
- Click Create New Report to start a new analysis from scratch.
Comments
0 comments
Article is closed for comments.